Have you ever wondered how to keep track of every click, swipe, or scroll on your website? Do you find yourself drowning in numbers without knowing which metrics matter most? Or perhaps you’ve heard people mention “GA4” but aren’t sure why it’s crucial for your site? If any of these questions sound familiar, get ready to explore a user-friendly guide that breaks down Google Analytics 4 (GA4) into practical steps.
In this post, you’ll get a thorough look at what makes GA4 different from Universal Analytics, plus all the reasons it’s a huge deal for businesses and websites worldwide. We’ll walk through essential setup tips, from linking GA4 to your site to avoiding common pitfalls that might skew your data. We’ll also look at how to interpret real-time reports, engagement metrics, and conversions—so you can make the most of this powerful platform.
By the end, you’ll see why GA4 is not just another analytics upgrade. It offers a fresh data model, deeper insights, and flexible reporting options that capture every part of the customer lifecycle. Whether you’re hunting for comprehensive resources or simply need guidance to navigate GA4 with confidence, this blog post will help you master the essentials. Let’s dive in!
Introduction to Google Analytics 4 (GA4)
What Is GA4 and Why Use It?
GA4 stands for Google Analytics 4—a next-generation upgrade of Google’s popular analytics tool. It shifts focus from session-based data to event-based data, allowing you to track specific actions (like clicks or downloads) in greater detail. If you’ve been using Universal Analytics for a while, you’ll notice that GA4 offers new ways to interpret user interactions.
But why bother? The capabilities in GA4 help you understand your audience on multiple platforms—web and app—without juggling countless views or complicated tracking codes. You’ll also find more flexible ways to measure conversions, which is handy if you want to track online sales, leads, or even offline interactions. GA4 also aligns with the changing privacy landscape, offering more durable measurement as third-party cookies phase out globally.
Key Differences Between Universal Analytics and GA4
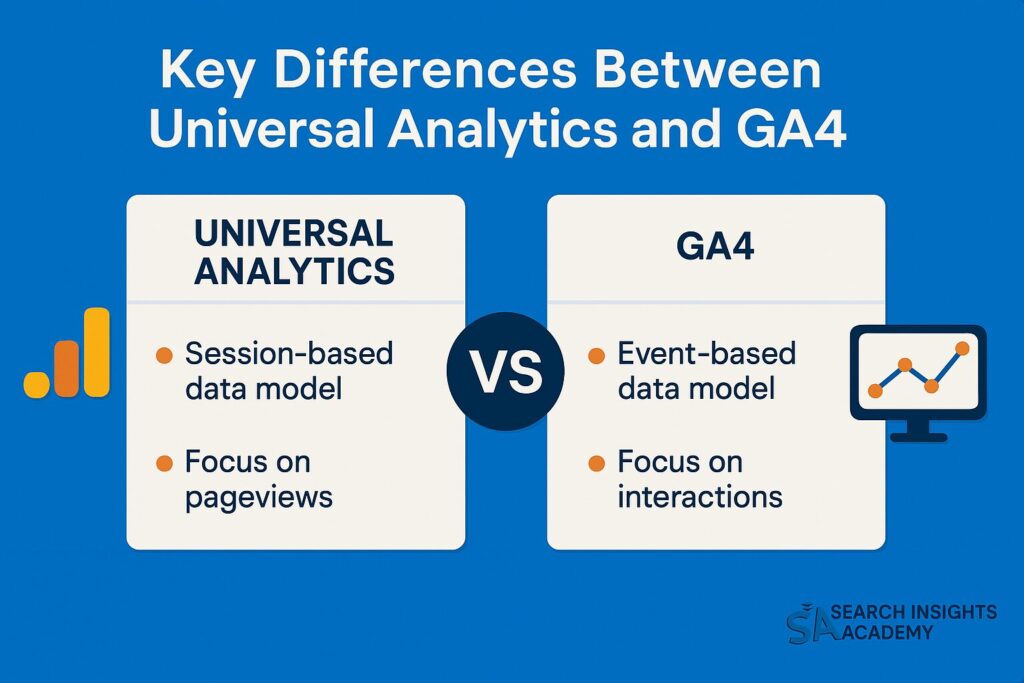
Universal Analytics relies heavily on sessions, while GA4 is built around events. Rather than simply looking at pageviews, GA4 considers any interaction—like video plays, scroll depth, or file downloads—as an event. The data model is fundamentally different, less about broad traffic and more about nuanced user behavior.
In addition, GA4 provides privacy-focused tracking. As regulations like GDPR in Europe, CCPA in California, and similar laws worldwide tighten around data usage, GA4’s approach helps you maintain compliance more easily. You’ll also find that GA4 streamlines reporting, segmenting users into more accurate life-cycle stages. Instead of jumping through multiple hoops to see how users engage, you can track their activity across apps and websites in one place.
Benefits for Websites & Global Audiences
Businesses often cater to unique markets, and GA4 offers insights that reflect specific audience preferences across different regions. For instance, you can explore how visitors navigate your site during holiday periods like Black Friday in the US, Boxing Day in the UK, Singles’ Day in China, or Australia Day down under.
Moreover, GA4’s event-driven approach helps you spot micro-conversions common in local contexts, like phone clicks on a “Call Now” button or clicks on a “Find a Store” link. These details can turbocharge your targeting when you run ads, and they offer real clarity about how well your website serves your community, whether they’re in Sydney, Seattle, or Stockholm.
GA4 Data Model Basics (Events & Parameters)
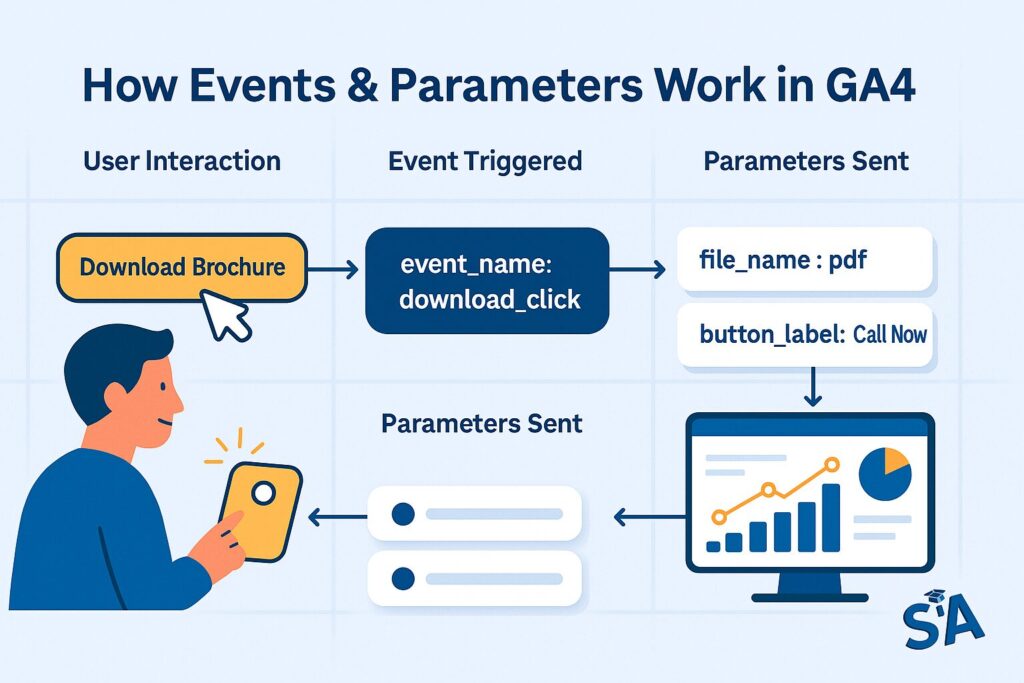
GA4’s data model revolves around two main concepts: events and parameters. Events are the core interactions—like when a user views a page, downloads a PDF, or completes a purchase. Parameters are extra bits of information describing these events, such as the page title or the value of a purchase.
This approach makes your data analysis more flexible. Rather than being locked into predefined categories like “pageview,” you can track everything that matters to your goals. For example, if you run a tourism site, you could log an event whenever someone clicks to watch a promotional video. Then, you can add parameters noting the type of attraction being viewed, whether it’s a beach in Queensland, a historic site in Rome, or a national park in Canada.
Setting Up Your GA4 Property
Creating a GA4 Property and Linking It to Your Site
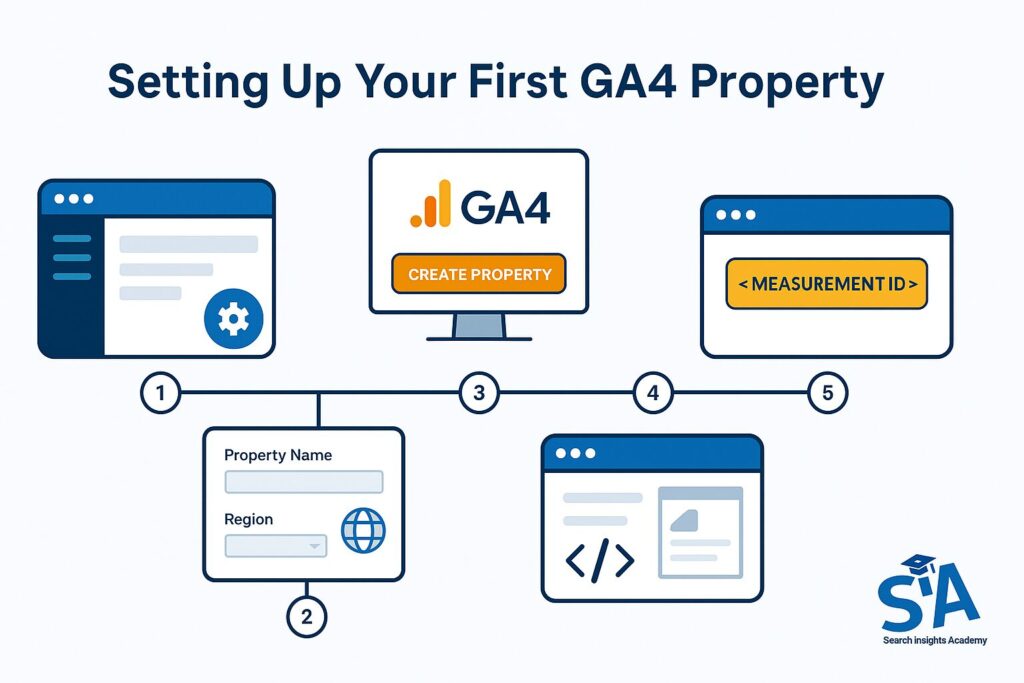
To begin, you’ll need to create a new GA4 property in your Google Analytics account. You can do this alongside your existing Universal Analytics property, so you won’t lose any current data. Once inside your Google Analytics admin panel, click “Create Property,” give it a name, and choose the appropriate region for your business.
Next, link your GA4 property to your site. This means you’ll generate a Measurement ID, which you’ll add to your site’s code or your tag management system. Google walks you through this in a straightforward manner, making it easy to get started no matter where you’re located.
Installing the GA4 Tag (Using gtag.js or Google Tag Manager)
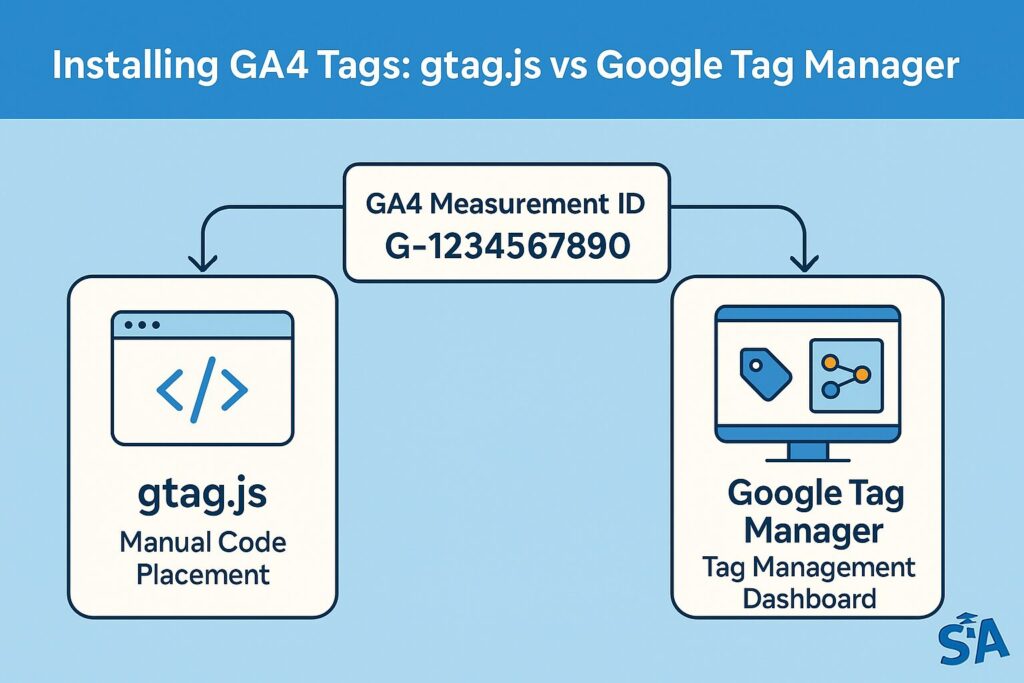
Installing GA4 tags can be done in one of two main ways: directly adding the gtag.js snippet to your website’s HTML, or using Google Tag Manager (GTM). If you prefer a simpler approach, embedding the gtag.js code works perfectly. But if you enjoy customization and more advanced options, GTM is the way to go. It lets you manage all your tracking tags in one place.
In GTM, you’ll create a new tag, pick “GA4 Configuration” as the type, and then insert your Measurement ID. You can also configure triggers to fire specific events at the perfect moments—like when a user clicks a “Download Brochure” button. It’s a neat way to track micro-conversions crucial to understanding your specific audience, whether they’re in Melbourne, Manchester, or Miami.
Configuring Data Streams (Web, App)
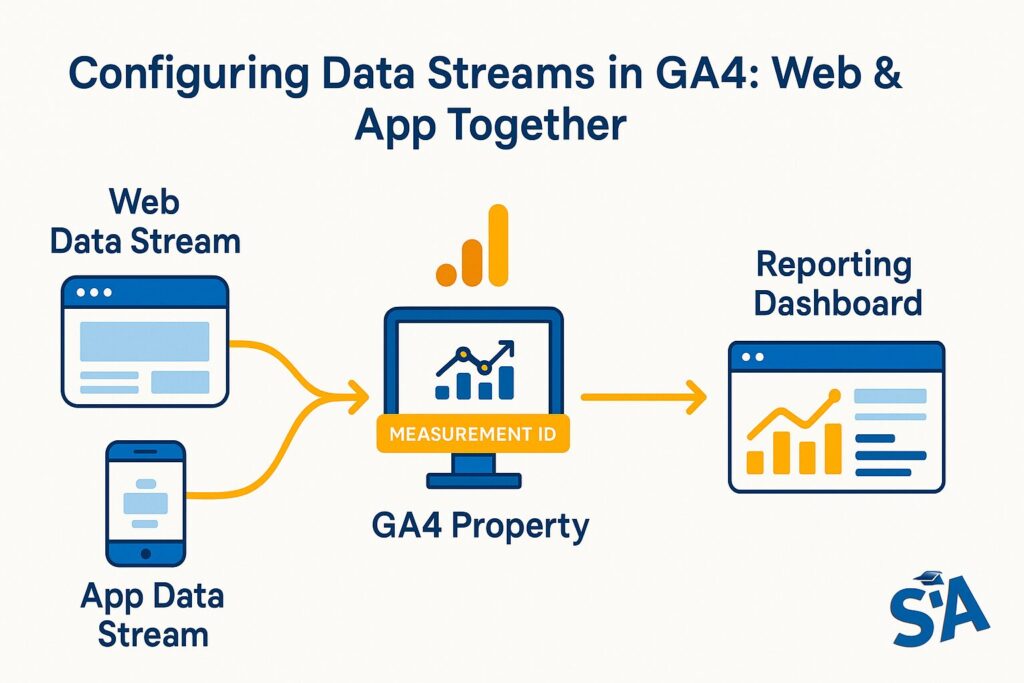
GA4 groups data from different platforms into what it calls “data streams.” If you have both a website and a mobile app, you can track them through a single GA4 property. That means you can unify user interactions across multiple channels, which is perfect if people move between your website and app.
To set this up, locate “Data Streams” in your GA4 Admin panel. Click on “Add Stream” and select whether it’s for a web or app platform. Provide the relevant URL and details, and GA4 will then supply a Measurement ID or integration instructions if you’re using Firebase for apps. This is ideal if you run, for example, an e-commerce site plus a mobile shopping app that appeals to visitors around the world.
Avoiding Common Setup Pitfalls
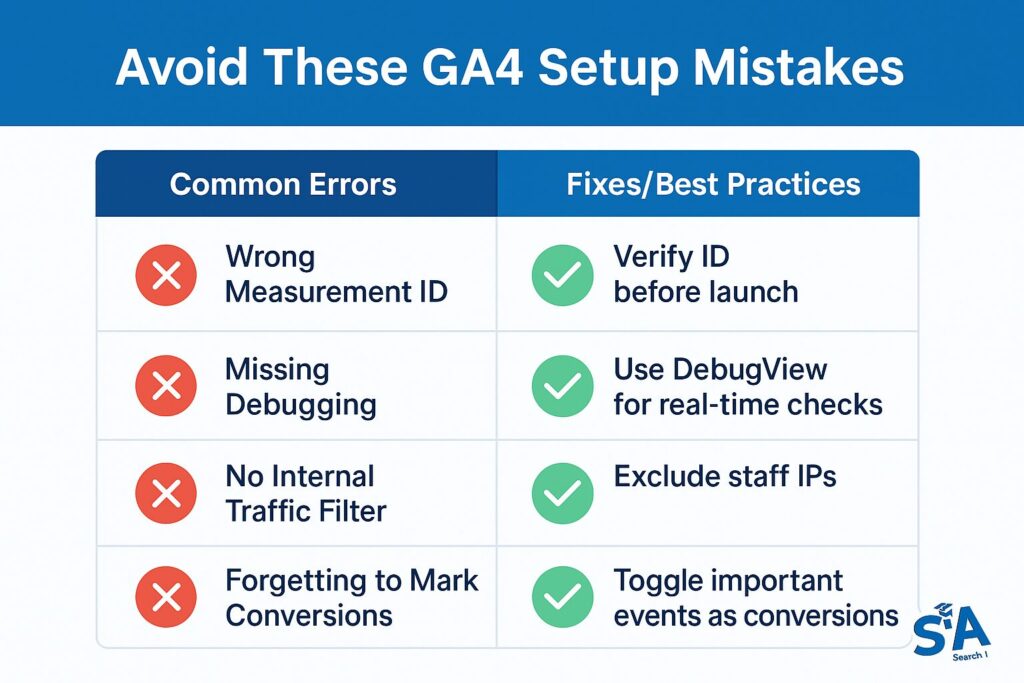
One frequent mistake is not testing your setup thoroughly. After you install your GA4 tag, verify it in real-time by opening your site in a new browser. Check the Real-Time report to confirm events are coming through. Another pitfall is forgetting to filter out internal traffic. If you or your colleagues browse the site frequently, you’ll inflate certain metrics.
It’s also wise to watch out for incorrect Measurement IDs. A simple typo can cause data gaps. Lastly, don’t skip the “Data Settings” options in GA4, which let you adjust how user data is retained. Tailoring these settings helps ensure accurate reporting while respecting various privacy regulations that may apply to your business.
Navigating the GA4 Interface
Overview of the GA4 Dashboard
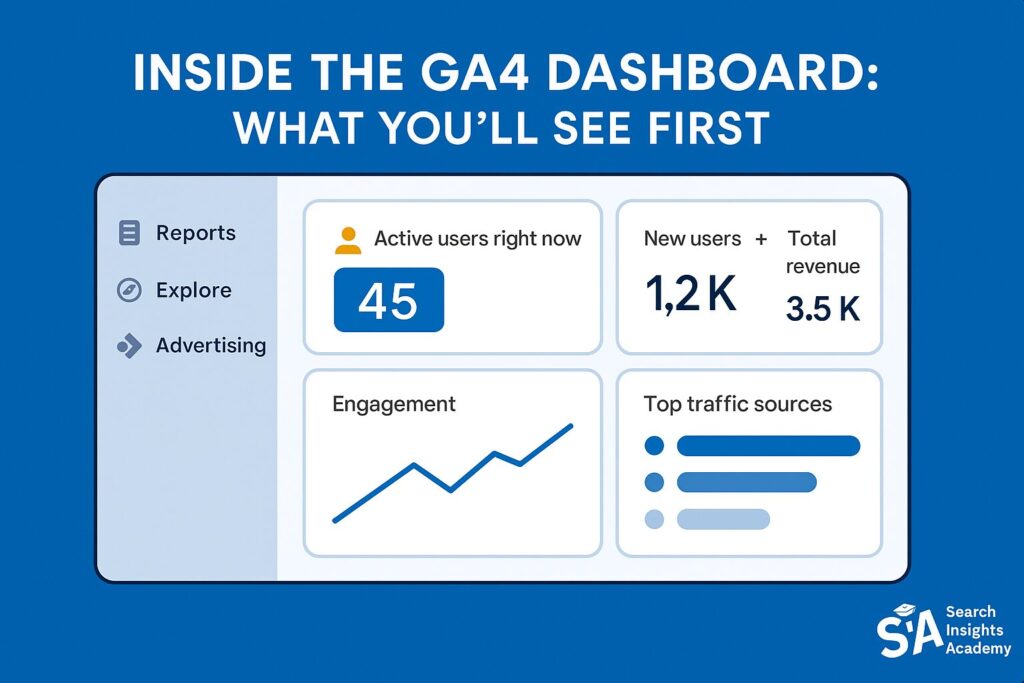
When you first open the GA4 dashboard, you’ll notice a clean, streamlined layout. There’s a left-hand menu with sections like “Reports,” “Explore,” and “Advertising.” The home screen offers a snapshot of user activity, including recent real-time data and top metrics like active users, new users, and total revenue if you have ecommerce enabled.
As you move through the interface, you’ll see that GA4 focuses on user journeys, from acquisition to engagement and retention. It’s less about trying to locate multiple different “views” and more about diving into insights that reflect a user’s life cycle. Whether you want to see how people found your site or what pages they spent the most time on, the dashboard provides quick access to those answers.
Real-Time View: Monitoring Live Activity
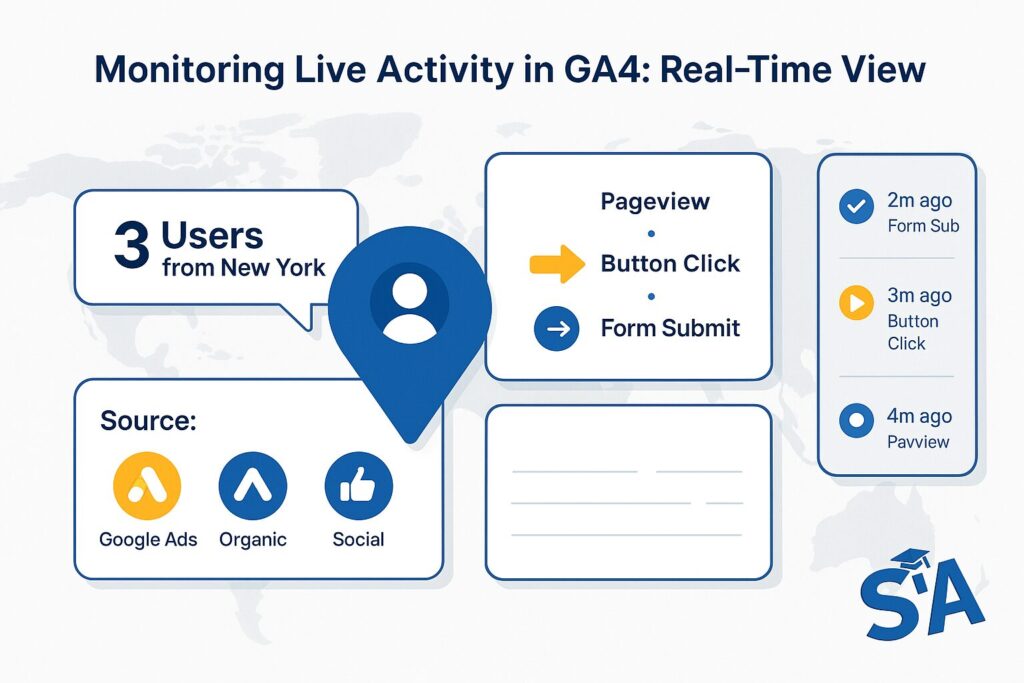
The Real-Time report in GA4 lets you watch what’s happening on your site or app in the past 30 minutes. You’ll see active users, their page views, events triggered, and the traffic sources bringing them in. This can be a lifesaver if you just launched a new marketing campaign.
For instance, imagine you’ve opened a Google Ads campaign targeting a specific city or region. By jumping into the Real-Time report, you can see who’s arriving from that region, what pages they interact with, and whether they reach key events like an account sign-up. It’s an immediate pulse check on your campaign performance, whether you’re marketing to customers in Brisbane, Berlin, or Boston.
Acquisition Reports: Where Is Your Traffic Coming From?
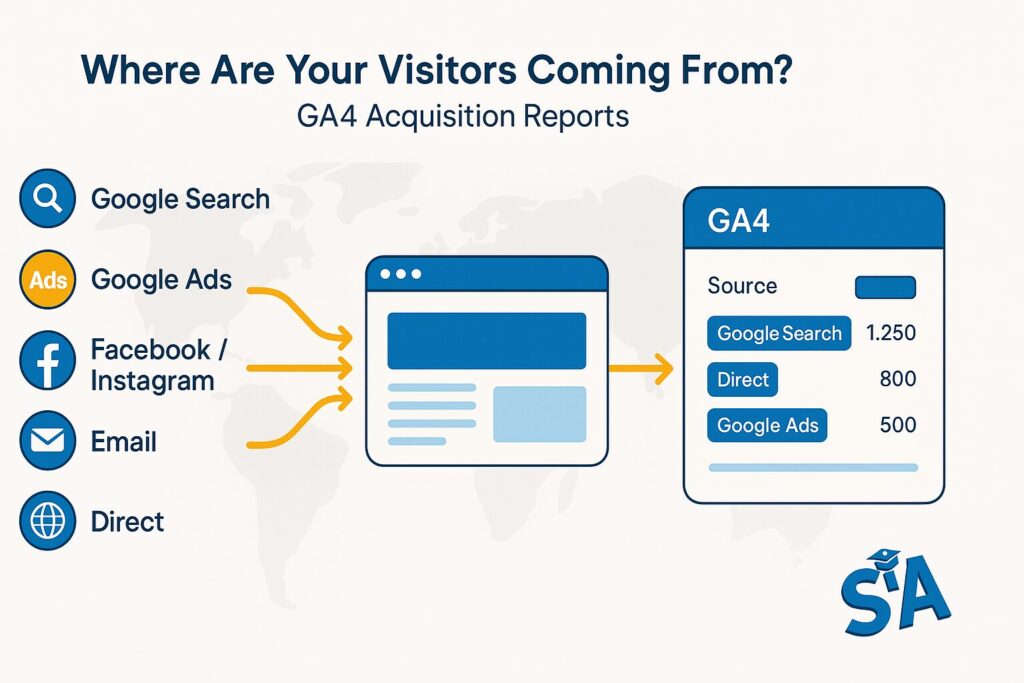
Acquisition Reports reveal how users land on your site. You can check if they come from Google Ads, organic search, or perhaps social media platforms like Facebook. GA4 displays this data in a user-friendly visual format, breaking down the sources, mediums, and campaign details.
These insights help you figure out which marketing efforts resonate with your audience. If you see that a particular email campaign is driving more sign-ups than a Facebook ad, you can prioritize your budget or refine the underperforming campaign. This is also where you’ll often answer questions like, “How do I use Google Analytics to see if SEO is working?” or “Which traffic sources should I focus on?”
Engagement Reports: How Are Users Interacting with Your Site?
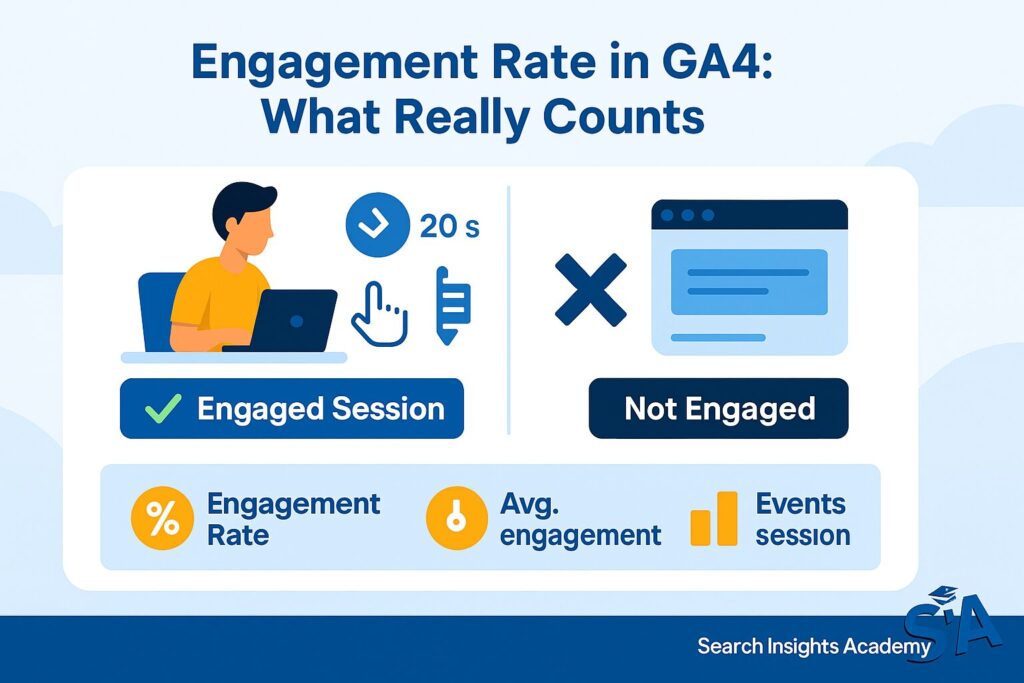
Engagement Reports drill into user behavior, showing how long they stay on your site, which pages they read, and what events they trigger. Instead of an old-school ‘bounce rate,’ GA4 features “Engagement Rate,” indicating the percentage of sessions that had any meaningful engagement (e.g., at least 10 seconds on a page or multiple page views).
This can help you spot differences in behavior among regions or user types. Maybe visitors from one country spend more time on your blog posts, while those from another go straight to your services page. Interpreting these patterns helps you serve more relevant content to your audience no matter where they’re located.
Monetization Reports: Tracking Purchases and Revenue (Ecommerce)
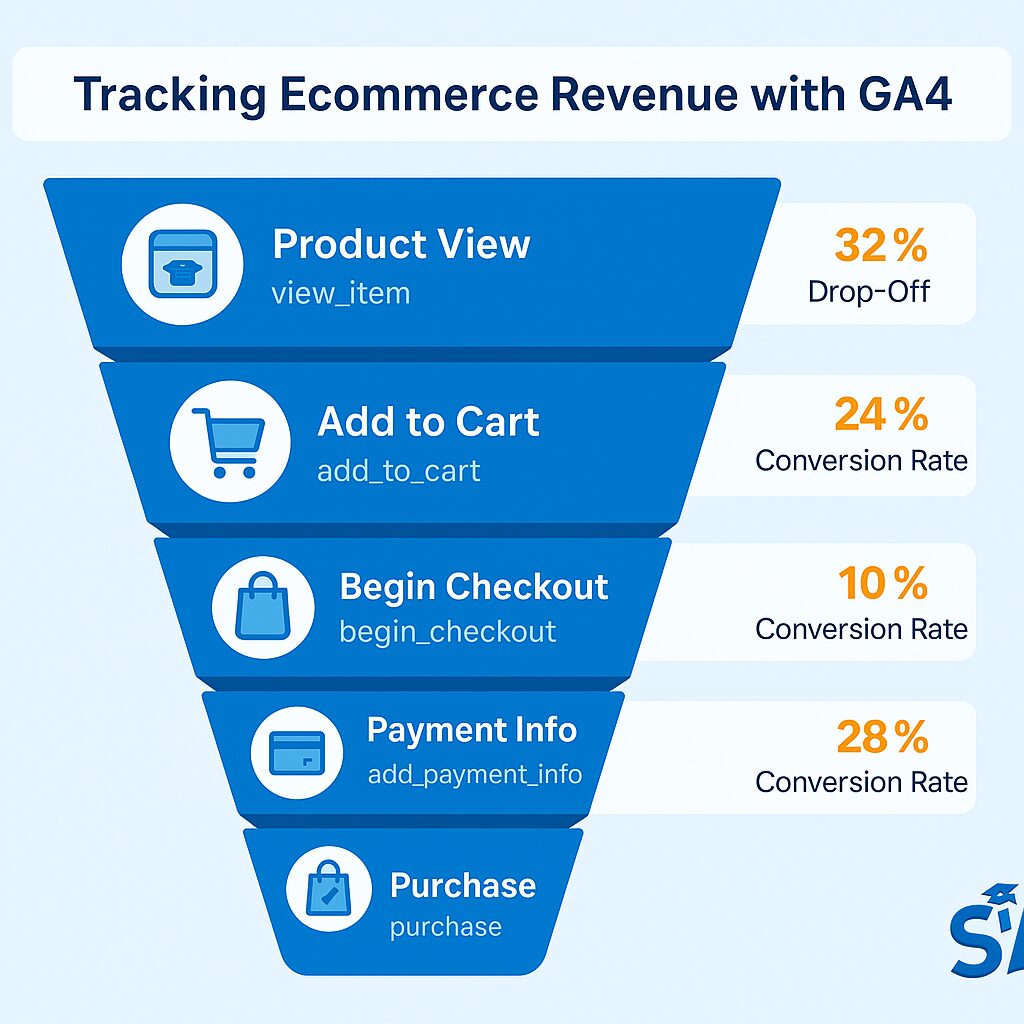
If you run an online store, the Monetization Reports in GA4 are your best friend. They show product sales, average order value, and overall revenue. You can tie these numbers to user-level data to understand which groups of visitors are most likely to buy.
Let’s say you sell seasonal products, and you see an uptick in sales from particular regions during certain months. You can then spotlight these campaigns further or launch special deals to retain those customers. GA4 also helps you track in-app purchases if you have a mobile app, so all your revenue data remains in one unified interface.
Retention Reports: User Lifetime Value and Cohort Analysis
Retention Reports focus on how frequently and for how long users return. Cohort Analysis allows you to group users by the date they first interacted with your site, then measure their behavior over time. If, for example, you notice that new users in a particular month keep coming back month after month, it suggests you’re doing something right—perhaps your content or products appeal strongly to that specific group.
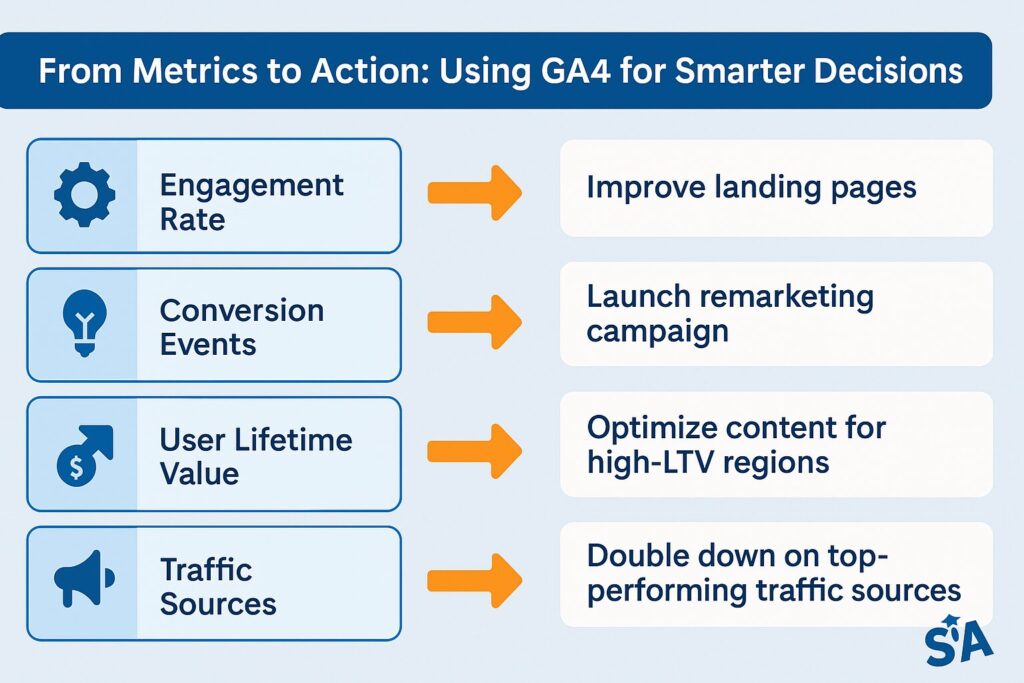
User Lifetime Value (LTV) is another metric to keep an eye on. It estimates how much revenue a user might generate, helping you make strategic marketing choices. For instance, if users from a specific region have a higher LTV, you might want to invest in local SEO or targeted campaigns to grow that audience segment.
Core Metrics and Terminology in GA4
Users, Sessions, and Pageviews in GA4
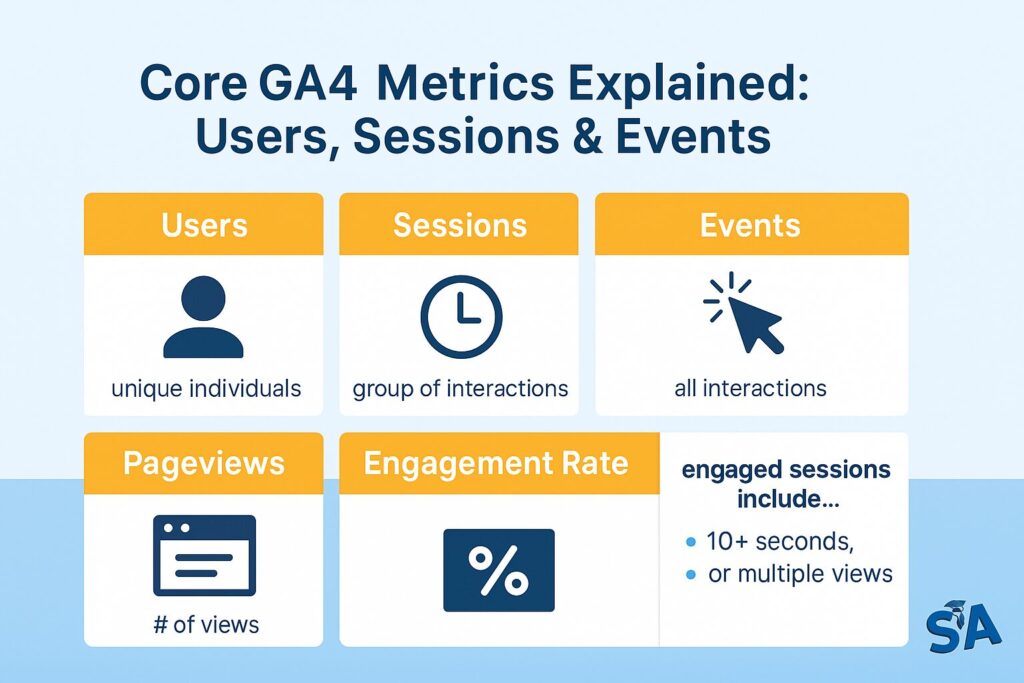
GA4 still measures users, sessions, and pageviews, but these metrics work a bit differently compared to Universal Analytics. “Users” captures unique visitor IDs (actual human visitors). “Sessions” mark periods of activity (visits), and “Pageviews” record how many viewing actions took place.
However, events are the real stars. Each session can contain multiple events, giving you a deeper look at how visitors interact. Rather than simply counting session lengths, you discover exactly which buttons users click, which videos they watch, and whether they share your pages on social media. This event-centric approach provides a much more granular view of user behavior.
Engagement Rate vs. Bounce Rate (What Changed?)
In Universal Analytics, bounce rate was the percentage of visits where a user only viewed one page. GA4 replaces that with an Engagement Rate, which tracks how many users actually interact with your site. An “engaged session” means a visitor stayed at least 10 seconds, viewed multiple pages, or completed a conversion event.
This shift focuses on meaningful interactions rather than punishing single-page visits. Imagine you’ve got a well-crafted blog post that answers a question right away. The person might leave after reading, but that doesn’t necessarily mean they bounced in GA4 terms if their on-page action met the engagement threshold. This is a much more nuanced approach to understanding how users interact with content.
Conversions, Events, and Parameters Explained
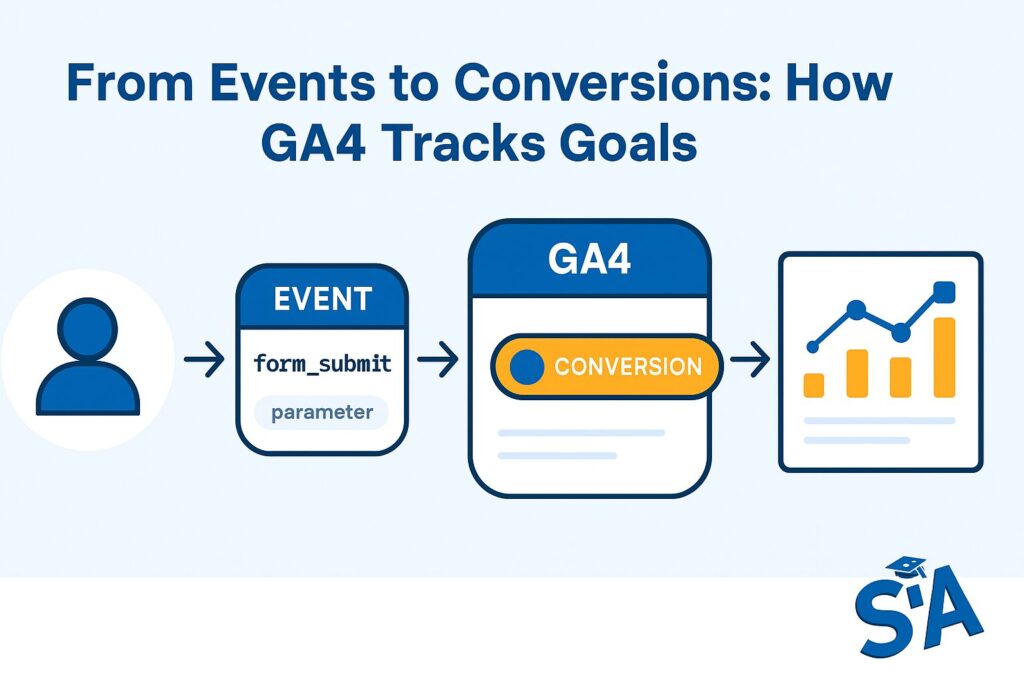
GA4 lumps all key actions into “events.” Some events are automatically collected (like pageviews), while others are recommended or custom events (like form submissions or file downloads). If these events are super important to your business, you can mark them as “conversions.”
Parameters accompany events and add descriptive details. For instance, if the event is “video_play,” a parameter could be “video_title=TravelTips.” This extra layer of data means you can break down events by categories that matter to your site, such as product type, location, or user device.
User Properties vs. Custom Dimensions
User Properties are attributes that relate to a user, such as location, device type, or membership status. They can be defined automatically—like your user’s language setting—or you can create your own properties, for instance “preferred product category.”
Custom Dimensions, on the other hand, are more flexible and apply to your events or user segments. If you’re running a membership site, you might create a custom dimension called “Membership Tier,” which tracks whether a user is “Free,” “Basic,” or “Pro.” By comparing these dimensions with user properties, you can craft even finer insights.
Configuring Conversions (Goals) in GA4
Conversions vs. Goals: Key Terminology Changes
If you’re used to Universal Analytics, you’ll remember “Goals” as the actions you wanted your visitors to complete. In GA4, these are now called “Conversions.” It’s essentially the same concept: a designated event that signals something valuable to your business, such as a purchase or a sign-up.
That said, GA4’s event-based approach gives you more flexibility in how you define these goals. Instead of setting them up as page-based or destination-based, you simply mark an existing event as a conversion, giving you a more streamlined way to monitor what matters.
Setting Up Conversion Events (Sales, Leads, etc.)
To create a conversion event, first ensure the event itself is being tracked. For example, if you want to track sales, you might have an event called “purchase.” Once that’s in place, head to the “Configure” section in your GA4 property, find the event you want to mark as a conversion, and toggle the switch.
For lead generation, you might set up a “form_submitted” event through your GTM triggers or code. Next, you’ll follow the same steps to label it as a conversion in GA4. You’ll soon have a clear view of how many leads you’re getting and from where—a must for businesses wanting to refine their marketing efforts globally.
Recommended Events vs. Custom Events
Google provides recommended events (like “login” or “sign_up”) that come with predefined parameter naming conventions. If these recommended events match your goals, using them can streamline your reporting and let you compare data across different properties.
However, you might have unique conversions specific to your business model. Perhaps you run a job website and want to measure “apply_job.” If an existing recommended event doesn’t fit, you can create a custom event. Just remember to define the parameters that truly matter (e.g., job_id, location).
Using DebugView to Validate Your Setup
DebugView in GA4 helps you confirm that your conversion events fire correctly. In the “Configure” section, open “DebugView,” then open your website in a browser with a GA4 debugging extension (or a GTM preview mode). You’ll see events populate live, allowing you to verify that your code is correct and your triggers work as intended.
This step is invaluable. You can immediately identify if an event name is misspelled or if parameters aren’t registering. Considering how easy it is to overlook small details, DebugView offers peace of mind before you start basing major marketing decisions on your data.
GA4 Explorations and Advanced Analysis (Optional for Beginners)
Creating Custom Explorations for Deeper Insights
If you’re ready to go beyond standard reports, the “Explore” section in GA4 is the place to be. Custom Explorations let you build your own data visualizations and tables. You can drag and drop dimensions and metrics, creating a bespoke report that fits your exact questions.
For example, you might want to see how new users behave differently across different regions or countries. By setting “User location” as a dimension and adding metrics like “engagement rate” or “purchases,” you’ll quickly spot which locations are your top performers. Better still, you can save these explorations and revisit them anytime.
Funnels, Path Analysis, and User Lifetime
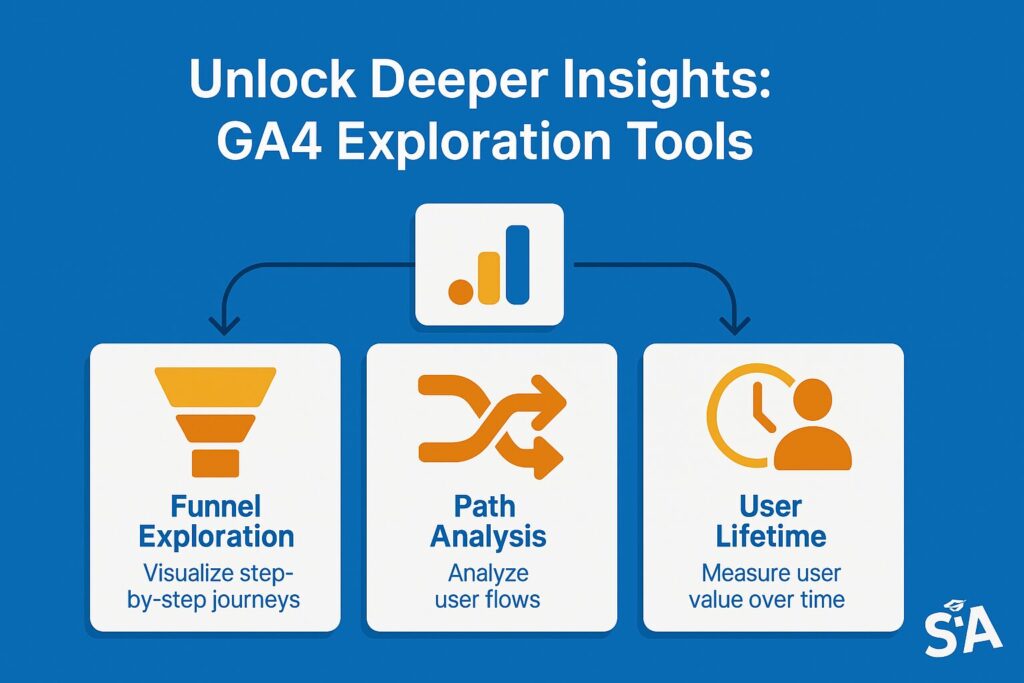
Within the Explore tab, you’ll find tools like Funnels, Path Analysis, and User Lifetime. Funnels show you where users drop off in a multi-step sequence—like from viewing a product to adding it to cart to checking out. Path Analysis traces each action taken by a user, helping you see their route through your content.
User Lifetime is a favourite for websites where repeat visitors and loyal customers matter most, such as subscription-based platforms. You can check how long users continue to generate value and which channels bring in those top-tier visitors in the first place.
Segments and Audiences in GA4
Segments let you filter your data by specific criteria—like new vs. returning users, or visitors from a certain city or country. Audiences are a similar concept but designed for targeting in Google Ads or remarketing. For example, you could define an audience of users who viewed a particular product category but didn’t buy.
By creating segments, you can explore how different groups behave. Are your younger visitors more likely to watch a video? Are users from certain regions more engaged with blog content? GA4’s segmentation tools make it easy to dig into these questions, guiding you towards data-driven solutions.
Cross-Domain Tracking and Referral Exclusions
Cross-domain tracking is vital if you have multiple domains, such as a main site and a checkout hosted on a separate domain. Without it, each domain switch might start a new session, confusing your funnel data. GA4 simplifies cross-domain tracking by letting you add multiple URLs in your data stream settings.
Referral exclusions come into play if you want to avoid counting certain sources as new sessions. For instance, if you use a third-party payment gateway, it could skew your referral data. By excluding that domain, you can maintain accurate tracking of where users actually come from.
Frequently Asked Questions (People Also Ask)
How Do I Get GA4 for My Website?
If you’re wondering “How do you use Google Analytics?” or “How to get google analytics for a website?” the short answer is: sign in to your existing Analytics account or create a new one, then follow the steps to create a GA4 property. You’ll set up data streams for each of your sites or apps, install the measurement tag, and voilà—you’re ready to go.
How Do I Interpret GA4 Data vs. Universal Analytics?
GA4 data focuses on events instead of just sessions. This means you should shift your mindset from page-centric to action-centric. If you’re used to seeing bounce rates, you’ll now look at engagement rate. Also, keep in mind that sessions and user counts might differ between Universal Analytics and GA4 due to distinct measurement methods.
How Do I Learn GA4 for Beginners?
To get started, you can browse Google’s own free GA4 learning resources. Many people also find value in online courses, video tutorials, or community forums where you can exchange ideas with others who are also navigating GA4. Digital marketing specialists also offer workshops and consultations worldwide.
Which Reports Are Most Important for Websites?
Reports that highlight user demographics and locations are especially useful if you’re focusing on specific audiences. Also, Real-Time reports can be helpful if you run timely campaigns, such as holiday promotions or flash sales. Engagement and Monetization reports are must-haves if you need to keep tabs on how visitors turn into customers, regardless of where they’re located.
What Resources Are Available for Learning GA4?
You’ll find an abundance of resources online, including the official Google Analytics Help Center. There are also countless blogs, YouTube tutorials, and online courses dedicated to GA4. These resources often include screenshots and step-by-step instructions to walk you through everything, from basic setup to advanced reporting techniques.
Troubleshooting and Best Practices
Common Setup Errors and How to Resolve Them
A typical error is not seeing any data populating in GA4. Double-check that your Measurement ID is correct and that you placed the tracking code in the right spot. In Google Tag Manager, verify your triggers and variables. Also, watch out for incorrectly configured filters that might block valid traffic.
Another problem is forgetting to mark vital events as conversions. You might be collecting data but missing out on crucial insights. Keep a list of your needed events, and systematically check they’re toggled as conversions. The GA4 troubleshooting guide can help identify and fix common issues.
Maintaining Clean Data (Filters, Bot Traffic, Debugging)
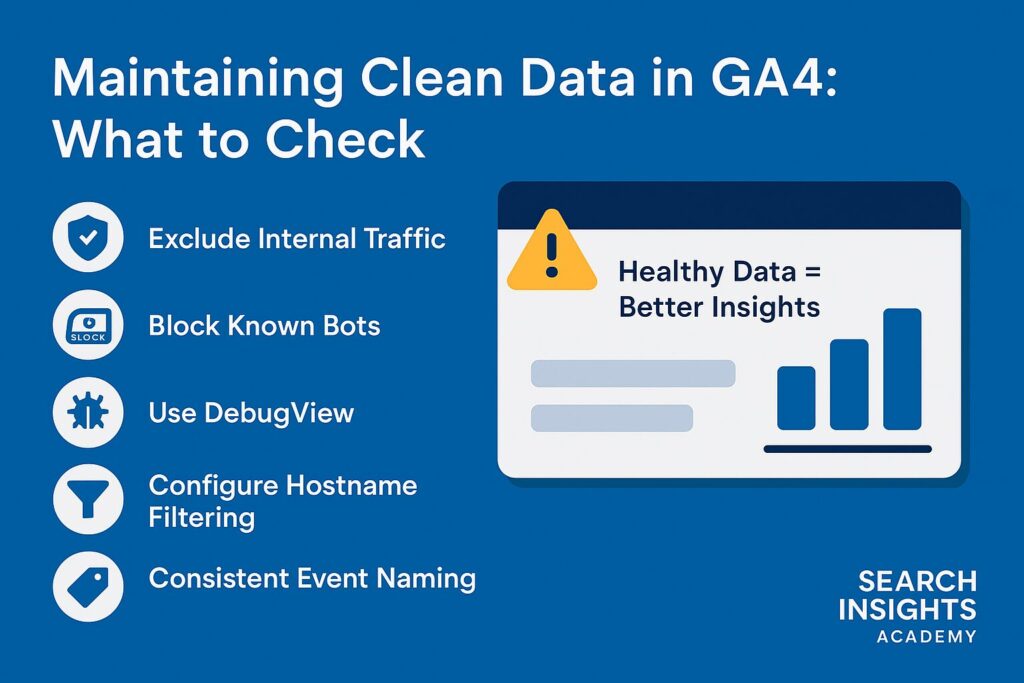
Accurate data starts with clean data collection. Filters can help you exclude internal traffic or reduce spam referrals from dubious sources. If you suspect spam or bots inflate your metrics, take time to set up host filtering or advanced segments.
Debugging is also critical. Make a habit of using DebugView to spot errors quickly. If you skip this step, you could spend hours scratching your head over data discrepancies that turn out to be simple typos in event names. Data quality best practices should be a priority for any analytics setup.
Integrating GA4 with Google Ads and Other Platforms
GA4 ties in smoothly with Google Ads, allowing you to measure campaign performance end-to-end. You can track the number of conversions each ad generates, whether it’s an online purchase or a newsletter sign-up. This data sync means your ad targeting becomes more precise, especially when you use audiences developed in GA4.
Beyond Google Ads, GA4 can also link to other tools like BigQuery for advanced SQL-based analysis. If your business deals with large volumes of data or you want to combine offline data sources, BigQuery integration can be a game-changer for deeper insight.
Setting Up Custom Alerts and Automated Reports
Sometimes, it’s easy to lose track of metrics if you’re not checking your dashboard daily. GA4 helps by letting you set up custom alerts for drastic changes. You might create an alert if your pageviews drop by more than 50% overnight or if a spike in conversions occurs.
Automated email reports are another handy feature. You can set up a weekly summary of your top events, revenue numbers, or traffic sources. This is helpful if you manage multiple sites or teams and need to provide quick updates. Custom alerts can be your early warning system for important changes in your data.
Practical Tips to Get the Most Out of GA4
Interpreting Key GA4 Metrics for Actionable Insights
It’s one thing to gather data; it’s another to translate it into action. Focus on a few core metrics—like engagement rate, conversions, and user lifetime value. Ask yourself: which metrics correlate most strongly with revenue growth or brand awareness? Once you identify these, you can tailor your marketing strategy around them.
Plus, consider building custom funnels or explorations to pinpoint where users drop off. If you notice a high quit rate on a signup form, you can investigate whether the form is too lengthy or unclear for your visitors. Data-driven decision making should be the goal of all your analytics efforts.
Tailoring Your Dashboard to Business Goals
GA4 lets you customize the dashboard, ensuring you see the metrics that truly match your objectives. If you’re an ecommerce store, you might prioritize revenue, purchase frequency, and average order value. If you’re more content-focused, emphasize pageviews, engagement time, and top performing pieces.
Regularly review and refine these dashboard views. Your goals can evolve over time, particularly if you venture into new product lines or expand into different markets. Updating your dashboard keeps your analytics aligned with your changing business needs. Custom dashboards help you focus on what matters most to your organization.
Regular Analysis and Ongoing Optimization
Once you’ve configured everything, it’s tempting to adopt a “set it and forget it” approach. However, analytics shine brightest when used continually. Schedule regular check-ins—maybe once a month—to see how your key events, conversions, and traffic sources are trending.
Use these insights to make specific improvements. If you discover that your blog posts in a certain category lead to more conversions, produce more content in that area. If your audience from a certain region drops off quickly, perhaps tailor your messaging or run targeted social media ads. Consistent analysis fuels ongoing optimization, elevating your site’s performance across all markets, whether in Australia, Europe, America, or Asia.
Conclusion and Next Steps
Recap of Essential GA4 Takeaways
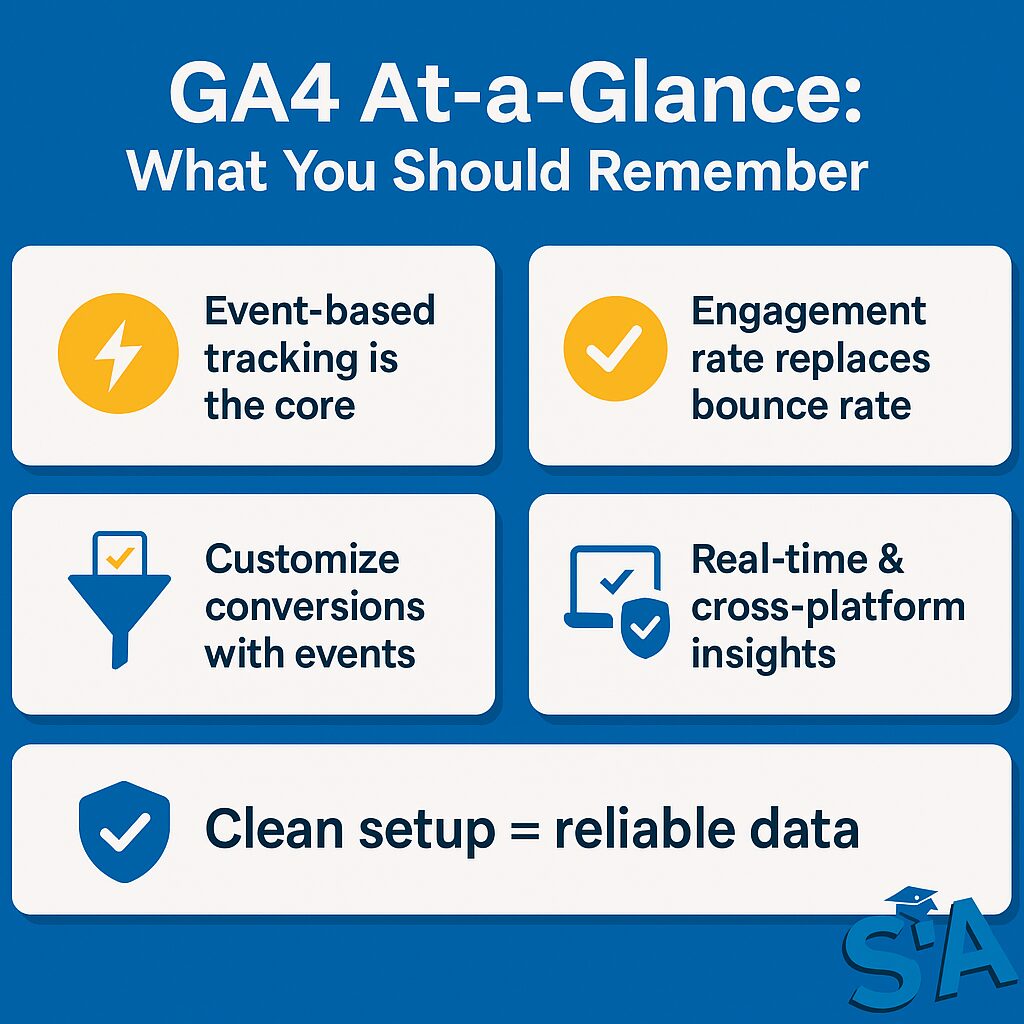
GA4 brings a fresh perspective to tracking and understanding your website’s performance. Rather than focusing solely on pageviews and sessions, you now have a flexible event-based model. This shift is particularly valuable for businesses that want to get granular insights into user interactions across various touchpoints—like campaigns, social media promotions, and cross-domain funnels.
Remember to keep your data tidy by filtering out irrelevant traffic. Embrace the real-time monitoring tools to stay on top of sudden changes or marketing pushes. And don’t forget to mark your high-value events (purchases or form submissions, for example) to see how many visitors convert into customers or leads.
Resources for Ongoing Learning
If you’re eager to level up, consider exploring Google’s official GA4 documentation and training resources. These materials offer detailed walkthroughs, so you can refer back to them whenever you get stuck. Google’s official trainings and workshops can also deepen your skill set.
Additionally, keep exploring the various advanced features in GA4. Try building custom explorations that match your unique website goals. Seek out the community forums where you can exchange ideas with others who are also navigating GA4. The platform is always changing, so staying current will ensure your analytics remain relevant.
Embracing Advanced Tactics for Future Growth
Looking ahead, GA4 is set to be the core analytics platform for years to come. As Google continues to enhance it, you’ll see deeper integrations with Google Ads, BigQuery, and other marketing tools. Getting on board early lets you adapt as new features roll out.
Whether your aim is to track conversions for an online shop, nurture blog readers into subscribers, or gain comprehensive insights into app usage, GA4 provides the flexibility and depth to help you succeed. Keep experimenting, refining, and exploring the data, and you’ll find that GA4 isn’t just another update—it’s your all-in-one guide to making smarter decisions in the modern digital sphere, no matter where in the world your audience is located.

